This paper estimates that the release of an additional ton of carbon dioxide today will cause mean damages to global mortality risk valued at $36.6 under a high emissions scenario and $17.1 under a moderate scenario, using a 2% discount rate that is justified by US Treasury rates over the last two decades. It is a core input to the Climate Impact Lab’s Data-driven Spatial Climate Impact Model (DSCIM).
Abstract
This paper develops the first globally comprehensive and empirically grounded estimates of mortality risk due to future temperature increases caused by climate change. Using 40 countries’ subnational data, we estimate age-specific mortality-temperature relationships that enable both extrapolation to countries without data and projection into future years while accounting for adaptation. We uncover a U-shaped relationship where extreme cold and hot temperatures increase mortality rates, especially for the elderly, that is flattened by both higher incomes and adaptation to local climate (e.g., robust heating systems in cold climates and cooling systems in hot climates). Further, we develop a revealed preference approach to recover unobserved adaptation costs. We combine these components with 33 high-resolution climate simulations that together capture scientific uncertainty about the degree of future temperature change. Under a high emissions scenario, we estimate the mean increase in mortality risk is valued at roughly 3.2% of global GDP in 2100, with today’s cold locations benefiting and damages being especially large in today’s poor and/or hot locations. Finally, we estimate that the release of an additional ton of CO2 today will cause mean [interquartile range] damages of $36.6 [-$7.8, $73.0] under a high emissions scenario and $17.1 [-$24.7, $53.6] under a moderate scenario, using a 2% discount rate that is justified by US Treasury rates over the last two decades. Globally, these empirically grounded estimates substantially exceed the previous literature’s estimates that lacked similar empirical grounding, suggesting that revision of the estimated economic damage from climate change is warranted.
Research Summary
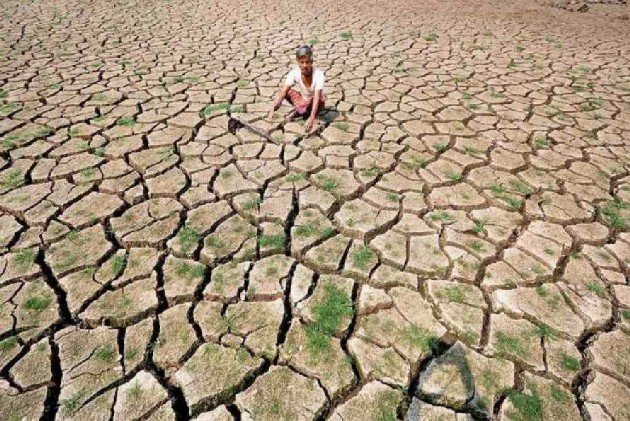
Communities are already experiencing a changing climate as temperature extremes become a familiar trend around the globe. How much is temperature to blame when hospital visits increase during heat waves and cold spells? What role do adaptations like indoor heating and cooling systems play in blunting these effects? And, at what cost? Empirical evidence of the risks extreme temperatures pose to human health is limited since fatalities often come from periods of heat or cold that worsen underlying conditions. Individual deaths are rarely attributed to temperature surges, so public health officials and policymakers often invest less in addressing and responding to climate change. The answers to these questions would inform policymakers, city planners, business leaders, and a range of stakeholders who are preparing to mitigate and adapt as the climate becomes more unstable.
Key Takeaways
- Using the largest data set ever compiled on subnational human mortality around the world, this study quantifies the relationship between temperature and death rates across the globe and identifies the role of income and protective adaptations, like indoor heating and cooling systems, in safeguarding public health.
- The authors use these data-driven results to project the future impact of climate change on mortality rates and the costs and benefits of adaptation measures that populations are likely to undertake. The study reveals the net effects of hot and cold temperatures on global health and the economy, dividing the world into 24,378 distinct regions and calculating impacts for each.
- Hot days with average temperatures above 35°C/95°F prove historically worse for global public health than cold days below -4°C/25°F. On average, a single hot day increases mortality rates by 4 deaths per 1 million people, while cold days increase the mortality rate by 3 deaths per 1 million people. But substantial differences exist between places, depending on how wealthy the population is and how warm the climate is.
- As temperatures rise, the damages to society grow with death rates increasing most among today’s poorest populations. By 2099 under a scenario of continued high emissions growth (SSP3-RCP8.5), climate change increases death rates in low-income countries by 106.7 deaths per 100,000. Meanwhile, high-income countries are projected to see death rates decrease by 25.2 deaths per 100,000, while spending significantly to prevent more deaths. Overall, today’s rich countries pay nearly three times more than poor countries to adapt to rising temperatures and prevent additional deaths.
- Previous experience living in hotter temperatures also leads to better outcomes. For example, Houston’s population fares better than that of Seattle, Washington, on a hot day because these two wealthy U.S. cities have differing levels of experience with extreme heat. Houston each year experiences at least eight days with a daily average temperature above 85°F, while Seattle experiences less than one of these days each year on average.
- Both income growth and protective investments to adapt to long-term climate change improve outcomes. In a future with continued high emissions growth, climate change’s impact on temperatures will cause an additional 73 deaths per 100,000 in 2100. This projection accounts for adaptations to climate that populations are likely to make, given historical patterns of adaptation. The benefits of adapting—reducing the death rate 29% from an average of 104 per 100,000—outweigh the costs, which would be equivalent to an additional 11 deaths per 100,000 people.
- The benefits of greenhouse gas reductions are large. Even mitigation efforts that fall short of the long-term targets of the Paris Agreement would cut the projected mortality costs of warming. Under moderate emissions (SSP3-RCP4.5), those costs fall by about 84 percent at the end of the 21st century, relative to a scenario of continued high emissions.
- The new analysis calculates that the mortality cost to society of each additional ton of CO2 is $36.6 per ton (using a 2 percent annual discount rate and a valuation that takes into account the age of those affected) under a scenario of continued high emissions and $17.1 per ton under a moderate emissions scenario. In other words, it would be worth it for society to pay roughly $36.6 per ton of CO2 to avoid the mortality impact from climate change.
Introduction
The world is already seeing signs that the climate is changing, with record-breaking heat being just one illustration. Summer 2019 was the hottest on record in the Northern Hemisphere, with countries across Europe experiencing their hottest days in history. The Southern Hemisphere also experienced record warmth, including in Africa where they broke their record for the warmest summer; South America where their summer ranked the third warmest; and India and Pakistan where they experienced their second-longest heat wave reaching 50.8 °C / 123.4 °F. June 2020 continued a record-breaking streak as one of the hottest months in history, as human-caused warming continues to push the Earth’s climate out of familiar territory.
Extreme heat impacts societies in many ways. One consequence that affects both the economy and human well-being is the toll heat takes on health, causing heat strokes and exacerbating existing respiratory and cardiovascular conditions. Heat places the body under great stress, straining the circulatory systems, and is particularly dangerous to very young children and those over 65. Reports of people dying from the heat can dominate headlines, with France reporting that 1,500 people died from the hot temperatures in Summer 2019. However, in general, research indicates that heat-related mortality is substantially underreported in the media, as it takes time for the full picture of excess mortality to emerge.
What exactly is the relationship between temperatures—both hot and cold—and mortality? How do we attribute deaths from a diverse set of causes to heat? How, and how much, do people adapt to extreme hot and cold temperatures, and what does it cost them to do so? What implications do these relationships have as the world heats up over the coming century? Knowing the answers to these questions at a local and global scale would be of tremendous practical value to policymakers, city planners, business leaders, and a range of stakeholders looking to mitigate these effects. Temperature’s toll on public health, particularly extreme heat, is likely to be one of the dominant costs of climate change, and because emissions today stay in the atmosphere for hundreds of years, knowing the damages will be essential to taking the action we need to prepare for future risks.
Researchers have struggled to provide a credible understanding of the damages inflicted by climate change at a local and global scale. Available data was limited to wealthy parts of the globe, resulting in insufficiently complete analysis that lacked the scale and scope to credibly describe a global response to warming. Further, there has not been a clear method to quantify the costs and benefits of adaptation. Because of these difficulties, theoretical models have been widely used to capture the global nature of the problem and inform understanding of the global costs of climate change. However, the many untested assumptions implicit in these models weaken the authority of these answers. Thus, to date, there have been no globally comprehensive, spatially resolved, data-driven studies of climate impacts that account for adaptation.
Research Design
In this study, the authors produce the first global, high-resolution, data-based estimate of the full costs of climate change on mortality, accounting for adaptation. Their methodology underlies all of the work of the Climate Impact Lab:
- Gather Detailed Global Economic and Climate Data: The first step is an unprecedented effort to aggregate highly localized historical data across key economic and climate indicators.
- Measure Climate-Driven Costs to Society: Millions of historical observations are then analyzed to understand and quantify the relationship between climate change and mortality.
- Inform Decision-Making at the Macro and Micro Levels: The socioeconomic relationships estimated from our current data are used to produce risk-based estimates of future changes at the local level, around the entire world.
Specifically, this study uses comprehensive historical mortality records to quantify how death rates across the globe have been affected by observed climate changes. The authors compile the largest sub-national vital statistics database in the world, detailing 399 million deaths across 41 countries accounting for 55 percent of the global population.
By combining these records with decades of detailed daily and local temperature observations, the authors discover that extreme cold and extreme heat have important effects on death rates. These relationships are modified by the climate and income levels of the affected population. They use these results to model how adaptation affects the sensitivity of a population to extreme temperatures.
The authors then use these estimates of the mortality-temperature relationship to generate projections of the future impacts of climate change on mortality rates for areas across the globe, dividing the world into 24,378 distinct regions (each containing roughly 300,000 people, about the size of a U.S. county). With a new technique to measure the total cost of adaptive behaviors and technologies, these projections capture the full mortality risk of climate change, for the first time accounting for both adaptation benefits and costs, in addition to direct mortality impacts.
These estimates include three projections for future income and population growth, two trajectories of future greenhouse gas emissions, and simulations from 33 climate models, allowing for an assessment of the uncertainty surrounding any particular projection. The full estimates also reflect statistical uncertainty related to the underlying economic and health data.
Projected impacts of climate change on mortality rates are then monetized and used to determine the costs of excess mortality risk in a given year. This allows the authors to compute the total monetary burden of the mortality risk imposed by the emission of a single ton of carbon dioxide (CO2).
This value represents the first empirically derived estimate of the global cost of climate change for a single sector of the economy. The authors are applying the method to other sectors of the economy (e.g. agriculture, energy systems), which will enable the calculation of the full social cost of carbon, including damage across many sectors of the global economy.
Findings
1. Each additional hot day increases the average annual global mortality rate by 4 deaths per 1 million people, while each additional cold day increases it 3 deaths per 1 million people.
The authors find both cold days and hot days result in elevated mortality risk. An additional day with a mean (average of the daily high and low) temperature above 35°C/95°F, relative to a day at 20°C/68°F, increases the annual all-age mortality rate by 4 deaths per 1 million people on average. An additional -5°C/25°F day increases this rate by 3 deaths per 1 million people. Relative to World Bank estimates, a hot day increases the global death rate by 0.05% while a cold day increases the death rate by 0.04%.
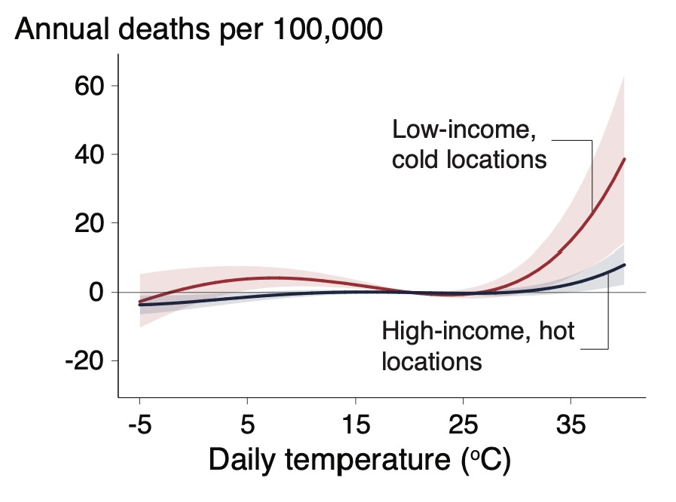
Figure 1: The impact of extreme temperatures on death rates depends on income and average climate. This figure shows the impact of a single day at each temperature on the annual mortality rate for people aged 65 and older. Higher incomes and warmer average climates lead to lower sensitivity to extremes, particularly for hot days. The shaded areas indicate 95 percent confidence intervals.
2. Those who are poorer, older, or have less experience in dealing with extreme temperatures are impacted more by hot and cold temperatures.
The risks of extreme temperatures are not felt equally around the globe. They vary by location depending on how wealthy or how warm a place’s climate is. For example, Houston, Texas, is better adapted to hot days than temperate Seattle, Washington, though both are relatively wealthy U.S. cities. On average, we estimate that days above 30°C/86°F increase the annual elderly mortality rate by 1.8 more deaths per 100,000 population in Seattle than they do in hotter Houston, relative to a day at 20°C/68°F. Globally, we find elderly people in the coldest third of locations fare worse when daily average temperatures surpass 35°C/95°F compared to elderly people in the hottest third of locations, experiencing an additional 7.9 deaths per 100,000.
Similarly, higher incomes help enable adaptation. For example, the poorer city of Delhi, India—with a climate similar to Houston—has been less able to adapt, resulting in 0.8 deaths per 100,000. In Accra, Ghana, the impact of a hot day is even worse: an additional 1.1 deaths per 100,000. Globally, we find elderly populations in the richest third of locations are less vulnerable than those in the poorest third of locations, with a day above 35°C/95°F causing 5 fewer deaths per 100,000 in the wealthier parts of the world.
Age and income are especially significant predictors of mortality impacts. If the research team only focused on the high-income countries, where mortality data is easily accessible (as done in previous studies), they would have underestimated the effect of heat on the vulnerable elderly population by 50 percent. Globally, the effect of an additional day above 35°C/95°F among people over age 64 is 4.7 deaths per 100,000. This highlights the importance of the comprehensive, evidence-based approach used by the Climate Impact Lab to capture climate change’s impacts worldwide.
However, these mortality risks are dramatically lower if efforts to lower carbon emissions are successful. Under a moderate emissions scenario that leads to an expected 2.4°C degrees of warming by the end of the century, the total mortality impact of climate change falls by 84 percent, relative to a scenario of continued high emissions that results in 4.5°C of predicted warming (Figure 2).
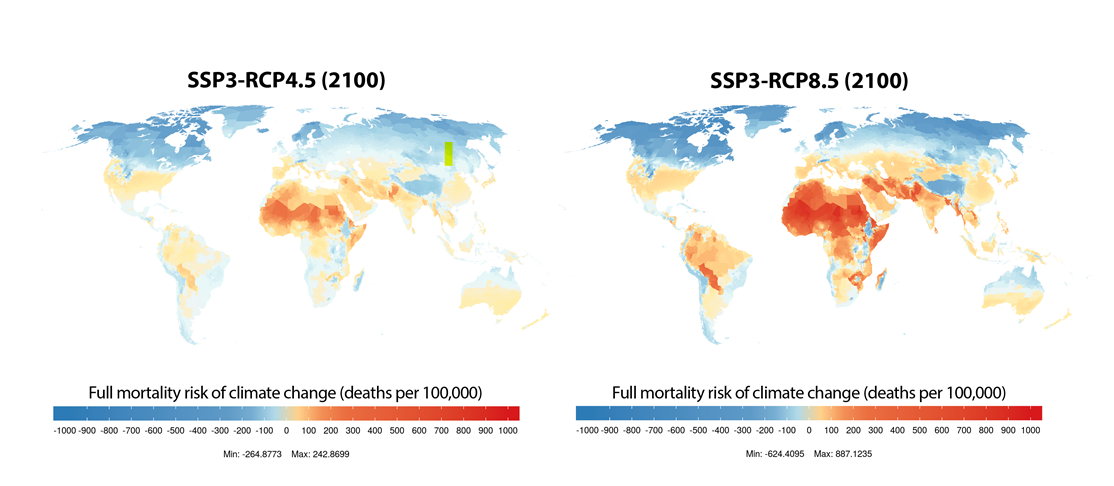
Figure 2: The mortality risk of climate change across the globe. The maps indicate the full mortality risk of climate change, including both increased mortality risk and changes in expenditures on adaptation measured in units of death-equivalents. Values are shown for the year 2100 under the moderate emissions scenario (SSP3-RCP4.5) and the high emissions scenario (SSP3-RCP8.5). Colors indicate the mean prediction for each region, averaging across 1,000 simulations.
3. Climate change’s impact on temperatures is projected to increase global death rates by 73 per 100,000 in 2100 under a scenario of continued high emissions, on par with today’s leading causes of death. Adaptation efforts can save lives, but the cost is significant.
The researchers find that climate change’s global impact on death rates in 2100 is on par with the current death rate for all infectious diseases—including tuberculosis, HIV, malaria, dengue, yellow fever, and diseases transmitted by ticks, mosquitos, and parasites—combined: approximately 74 deaths per 100,000 globally (Figure 3). These projections account for the beneficial effects of adaptation to climate change, but not their costs. Using a commonly accepted statistical metric for valuing death risk, the authors convert these adaptation costs, representing about 13 percent of the total impact, to equivalent changes in the death rate.[1] They estimate the full mortality risk of climate change under a scenario of continued high emissions to be an additional 85 deaths per 100,000 annually by 2100. For context, all cancers are responsible for approximately 125 deaths per 100,000 globally today.
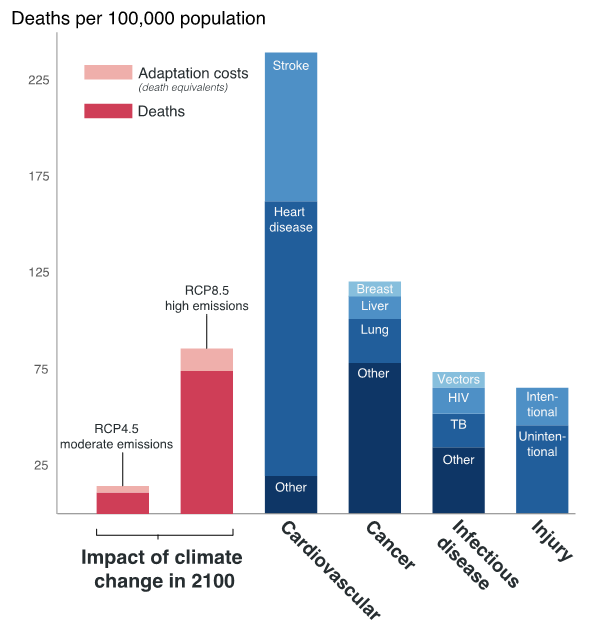
Figure 3: The impact of climate change in 2100 is comparable to the contemporary leading causes of death. Impacts of climate change (coral) are calculated for the year 2100 under the high emissions scenario (SSP3-RCP8.5) and moderate emissions scenario (SSP3-RCP4.5) and include changes in death rates (solid colors) and changes in adaptation costs, measured in death-equivalents (light shading). Blue bars on the right indicate average mortality rates globally in 2018, with values from WHO (2018).
Failing to account for income and climate adaptation, as has been the norm in the literature, would substantially overstate the mortality costs of climate change—causing an additional 221 deaths per 100,000 under a high emissions scenario, instead of 85. This mortality rate is roughly equivalent to all cardiovascular disease deaths today. Accounting for future income growth reduces the mortality risk of climate change to 104 deaths per 100,000 annually; accounting for the benefits of climate adaptation reduces it further to 73 deaths per 100,000 annually.
4. The death risk of climate change disproportionately falls on regions that are poorest and hottest today, exacerbating existing inequality.
While the average global mortality risk of climate change is equivalent to causing an additional 85 deaths per 100,000 in 2100, in Accra, Ghana, the mortality risk is roughly 160 deaths per 100,000 people. In contrast, colder and relatively wealthier Oslo, Norway, will see benefits equivalent to saving approximately 230 lives per 100,000 people. These differences reflect Oslo’s means to adapt to additional warm days, as a wealthy nation, and the benefit that the population experiences as climate change reduces the number of deadly cold days. As shown in Figure 4, in high-income places such as Oslo, the mortality-related risks of climate change are mainly damages to the economy because of increased adaptation costs. In some cases, cooler regions spend less to protect against cold-related deaths as temperatures rise, an impact that benefits the economy. In contrast, in low-income places like Accra, the damages of climate change are projected to be felt as significant increases in death rates on hot days.
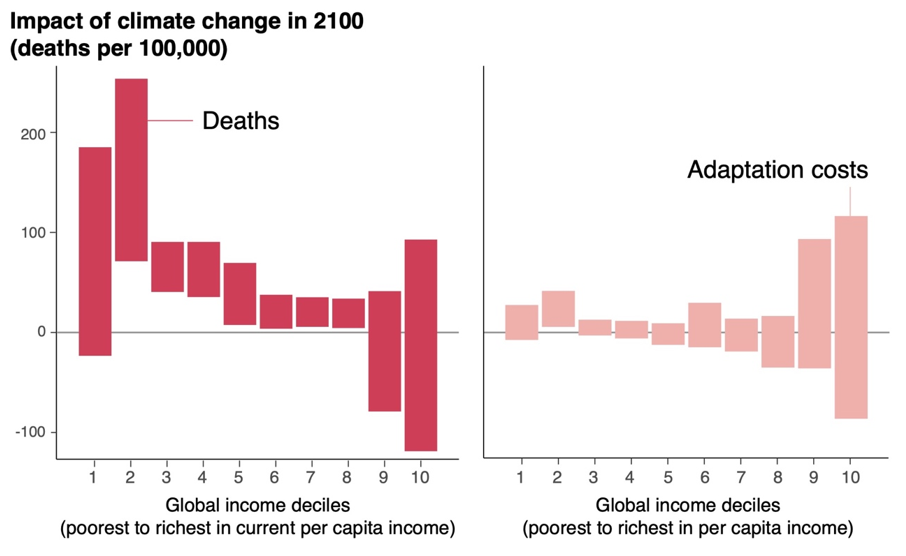
Figure 4: Climate change causes increased death risk for the poor, and increased adaptation spending for the wealthy. Both panels show the change in annual mortality rates due to climate change in 2100 under continued high emissions (SSP3-RCP8.5) against deciles of 2015 per capita income. Each box indicates the interquartile range of predicted estimates, where uncertainty is calculated across 1,000 simulations. Changes in mortality rates (red) and adaptation costs (pink) are reported from poorest (decile 1) to richest (decile 10). Using a statistical metric for valuing mortality risk, the researchers measure adaptation costs in units of deaths per 100,000.
5. Across the globe, it is worth paying $36.6 per ton of CO2 to avoid the mortality impact from climate change
When mortality costs around the globe are totaled, the researchers find that the present-day value of emitting an additional ton of CO2 is $36.6 per ton under a scenario of continued high emissions. This estimate applies a 2 percent discount rate, consistent with U.S. Treasury rates over the last few decades, and method of valuing death risk that takes age into account. The likely range[2] for this value spans from -$7.8 to $73. This number is also known as the “Partial Mortality Social Cost of Carbon.” A “full” Social Cost of Carbon would encompass climate change impacts across all affected sectors of the economy. Stated another way, we should be willing to pay $36.6 per ton today to avoid the future mortality consequences of climate change. Under a scenario of moderate emissions, in which CO2 emissions are stable through 2050 and then decline, this global value falls to $17.1, with a likely range of -$24.7 to $56. The method for estimating these results differs from the U.S. government’s approach, which puts identical values on all lives lost and assumes a discount rate of 3 percent.
Applying the same valuation method and a discount rate as the Obama administration’s Interagency Working Group, the Climate Impact Lab estimates that the Partial Mortality Social Cost of Carbon for mortality is $22.1 under scenario of continued high emissions. This represents 44% of the Obama administration’s full Social Cost of Carbon—roughly $51 per ton of CO2 emitted in 2020—the most robust and credible estimate available. Previous research has attempted to tease out the value of health impacts in the three Integrated Assessment Models that underlie that estimate. Still, academic literature gives limited options for comparison. The FUND model, for example, reports values for comparable health impacts that total less than $2 (2019 USD) (Figure 5). The Climate Impact Lab’s empirically grounded damage estimates point to the need for continued revision of the Social Cost of Carbon estimates. Current U.S. policy relies on the Trump administration’s full Social Cost of Carbon, which includes only damages experienced within the U.S., assumes a 7 percent discount rate, and amounts to $7. The U.S. Government Accountability Office recently found[3] the Trump administration’s estimates do not rely on the best available science.
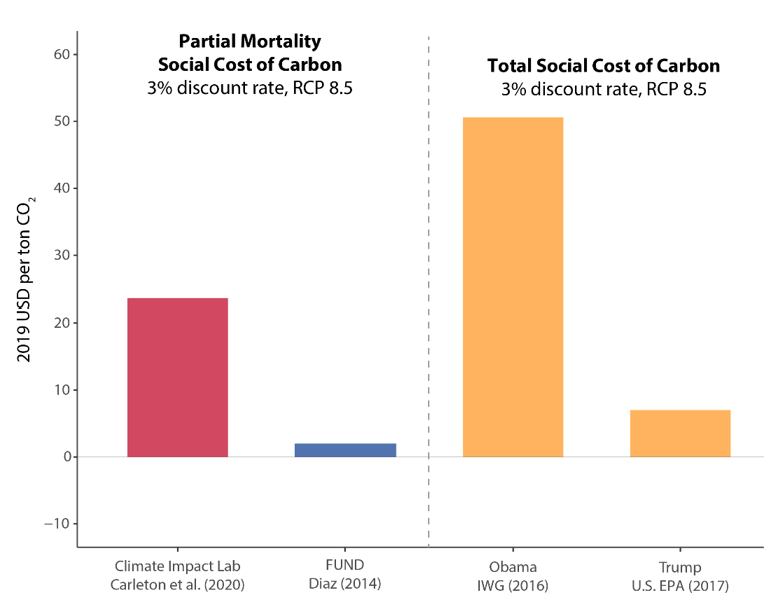
Figure 5: Estimates of a partial Social Cost of Carbon (SCC) for excess mortality risk from the Climate Impact Lab, compared to existing partial and full SCC estimates. Climate Impact Lab and FUND estimates account only for mortality-related costs; Obama administration and Trump administration estimates account for all sectors of climate change impacts. Trump Administration SCC values include only damages within the United States, while all others shown reflect global damages.
Policy Implications
These results provide essential information for policymakers forming strategies to reduce the impacts of climate change because they capture the benefits, in terms of mortality, of reducing CO2 emissions. Further, the results provide estimates of the changes in mortality risk for 24,378 unique regions that together account for the entire world. Having this localized information provides key insights for policymakers at all levels of government to debate the importance and value of investing in adaptation measures. It is also important to note that the researchers’ estimate of the Partial Mortality Social Cost of Carbon suggests taking a second look at the U.S. government’s previous best assessment of future climate damages.
Data availability
The data for replicating the findings of this study are available on Zenodo at https://zenodo.org/record/6416119#.Ynlh6xPMJhH.
Code availability
The code for replicating the findings of this study is available on GitHub at https://github.com/ClimateImpactLab/carleton_mortality_2022.
[1] The sum of changes in the mortality rate and adaptation costs represents the full mortality-related risk of climate change. The authors use the Value of Statistical Life to convert the dollars spent on adaptation to “death-equivalents,” which are defined as the change in the mortality rate that the population would be willing to accept in order to avoid paying higher adaptation costs.
[2] The interval presented represents the inter-quartile range of uncertainty, accounting for both climate sensitivity uncertainty and uncertainty in the estimated relationship between monetized losses and rises in temperature.
[3] U.S. GAO “Identifying a Federal Entity to Address the National Academies’ Recommendations Could Strengthen Regulatory Analysis” June 2020 https://www.gao.gov/assets/710/707776.pdf