

Abstract
As California invests in climate mitigation and adaptation, it is essential to understand the relative impact of climate change across the state’s diverse communities. This report supports ongoing efforts by the California Air Resources Board (CARB) to better understand the impacts of greenhouse gas emissions on human welfare by introducing the Climate Vulnerability Metric (CVM). The CVM is the first metric in California specifically focused on quantifying the community-level impacts of a warming climate on human welfare.
The CVM is an aggregation of the impacts of climate change that can be quantified at the census tract level using currently available research. The CVM includes the projected impacts of climate change on human welfare across four impact categories through midcentury (2050) under a moderate emissions scenario (RCP 4.5[1]) that is broadly consistent with the world’s countries meeting their current emissions reduction pledges under the Paris Climate Agreement. This time horizon has the benefit of capturing the collective effect of current and near-term global greenhouse gas emissions on California’s climate system. There are nine components of climate impacts (Figure ES1) that when aggregated, are the total CVM in each census tract.
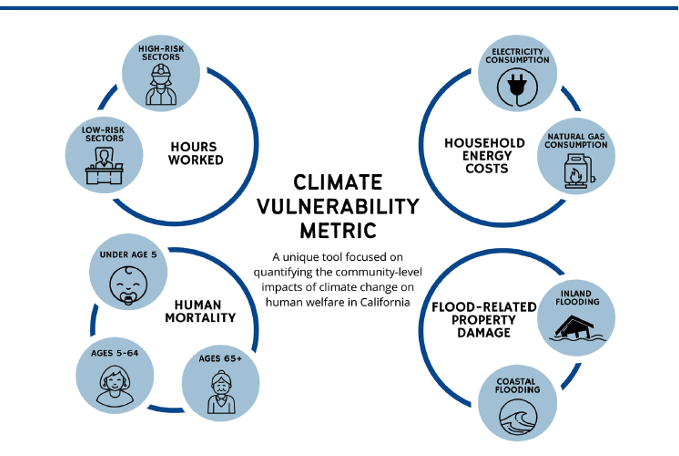
The CVM is constructed by aggregating climate change impact estimates across the nine impact components shown in Figure ES1. In order to ensure that the CVM represents the diversity of California communities, it is reported as the aggregate monetized impact of climate change as a percentage of census tract-specific incomes.[2] This format accounts for current levels of economic inequality across California and captures the impact of a warming climate on fundamental aspects of community well-being such as public health, housing, and our ability to earn a livelihoodlower impacts and/or greater resilience, while a negative CVM value represents a projected beneficial impact of moderate climate change by 2050. Figure ES2 outlines the five-step method used to calculate the CVM.
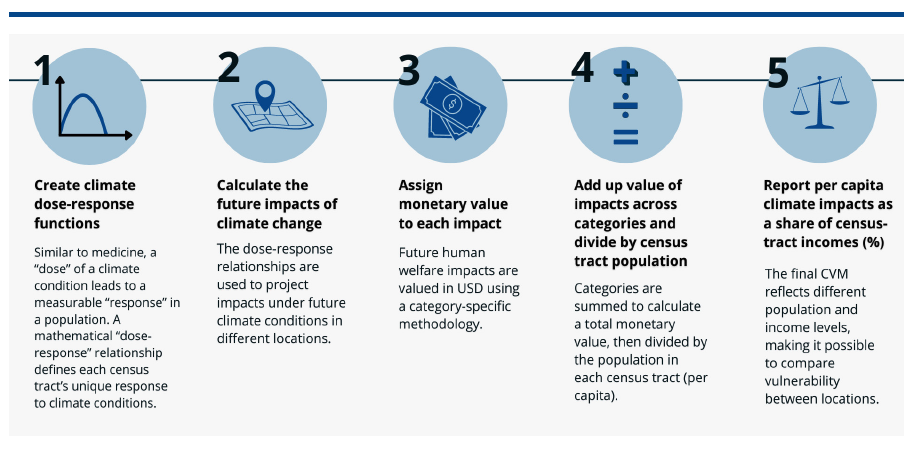
Figure ES3 presents a map of the CVM at the census tract level. Each census tract CVM value is a comprehensive total of the 9 category-specific estimates, calculated using the five-step method described in Figure ES2.
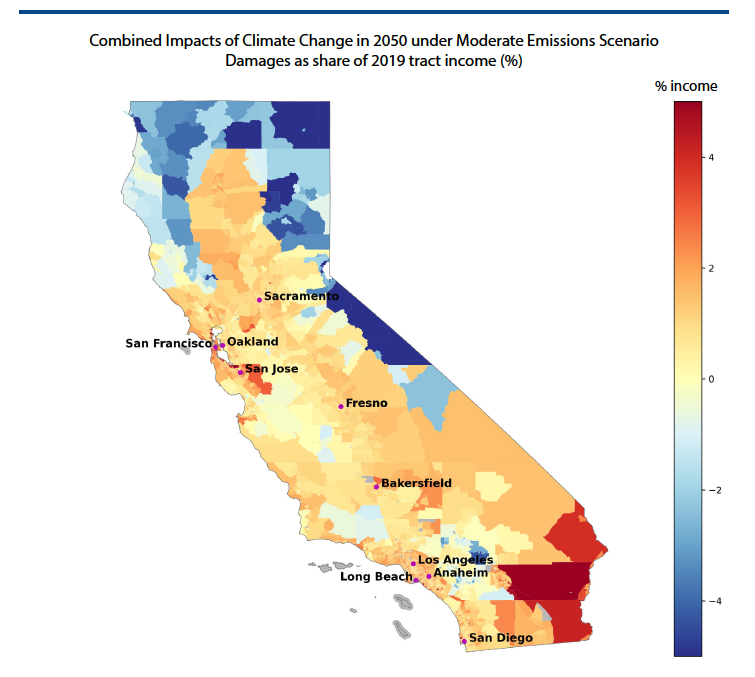
The CVM shows that climate change will have highly unequal impacts across Californian census tracts. While some regions in the southeast are estimated to suffer damages that exceed 5% of annual income, other high-elevation regions are estimated to see benefits of up to 10%. Some low-lying urban areas are estimated to be particularly vulnerable, while much of the Central Valley suffers at least moderate damages. The wide diversity of projected impacts underscores the importance of estimating climate vulnerability at a community level.
As a tool for California policymakers and communities, the CVM provides information about the relative climate vulnerability that Californians may face in the future. The CVM can direct funding to communities with higher relative climate vulnerability for adaptation and mitigation. In addition, the CVM can direct funding by impact category — census tracts with high energy cost impacts could receive reduced rate plants or targeted funding. The CVM can also be used by policymakers to designate communities as “vulnerable” to climate change or “disadvantaged” similar to the approach in CalEnviroScreen. The CVM can also be used in combination with existing screening tools to identify communities that are vulnerable to the impacts of climate change as well as current environmental and health hazards.
It is important to note that the impacts included in the CVM do not represent the total cost climate change will likely impose on individual and household welfare across California. For example, currently available research is not robust enough for us to include a quantification of the impact of climate change-driven changes in wildfires on human welfare at a census tract level. There are also areas of California, including rural and tribal communities, that are not accurately reflected through a census tract level tool. Additionally, the CVM can be expanded to include additional socio-demographic data that better reflects the under-represented regions of California. As climate economics research continues to mature, the CVM can be expanded to include additional categories and improve the coverage and granularity of communities, offering a more comprehensive assessment of vulnerability. While these are important limitations, the CVM represents the only census tract-level analysis of climate vulnerability across California. Critically, the CVM is built from community-specific estimates of vulnerability to climate change, and it will be straightforward to build upon these estimates as future research evolves.
[1] Representative Concentration Pathway (RCP) 4.5.
[2] Per capita income in 2019 for census tracts across California ranges from $633 to $176,388, with a median of $32,181 ($2019). Source: American Community Survey.