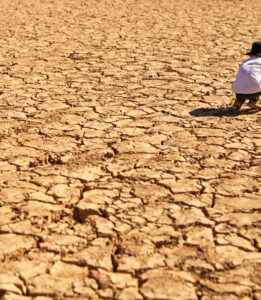
Scientists project that global land temperatures will be 1.2°C/2.1° F above normal in the coming months due in large part to the current “Super El Niño” that began in June and is expected to last through Northern Hemisphere spring. These anomalously warm conditions will resemble the higher temperatures that climate change is projected to deliver 20 years in the future (figure below) and will lead to 44% more extremely hot days than we would expect in a normal year. El Niño is effectively pushing us into the future – exposing us to temperatures that won’t be the norm for another two decades – before we have time to adapt and protect ourselves.
As a result, we project that 451,000 lives will be lost due to heat the first nine months (June-February) of El Niño, compared to a normal year[1]. This is about 65 times larger than the 6,800 people believed to be dead or missing from the recent Nepal flash flood. In just the next 6 months, this includes 239,000 ± 11,000 [2] deaths across the globe[3]. With current forecasts suggesting El Niño will remain in place through spring 2027, we expect all of these numbers to grow even higher, particularly as impacts such as higher-than-average temperatures and heat-related deaths will linger into June and July.
Global, population-weighted temperature anomaly from historical (ERA5[4] monthly mean anomaly; grey), seasonal forecast (ECMWF SEAS5[5] monthly ensemble mean anomaly; red), and climate model projection datasets (IPCC AR6[6] (CMIP6 SSP3-7.0) September-February annual mean anomaly with a left-handed 10-year rolling average (blue) and likely range (17th-83th percentile; blue shading)
With these timelines in mind, there is time to reduce the numbers of lives lost by tens of thousands with targeted action. This brief identifies the regions where the greatest number of people are projected to die from extreme heat, and in turn, pinpoints where immediate action offers the greatest opportunity to save lives. Paired with an accompanying web tool, we give decision makers at every level the clarity and specificity to act before, not after, the deaths occur (see map).
The heat deaths that are still coming this year will hit the Global South the hardest
Regions that are projected to see the largest increase in heat-related deaths over the next six months are spread across the Global South. The most impacted countries across the Sahel are forecasted to see an additional 66,800 heat deaths from September-February compared to a normal year, with nearly half of those lives being lost in Nigeria (31,400). Elsewhere in the region, Sudan will face 17,500 additional heat deaths, Niger will face 10,000, and Chad 8,000. In South East Asia, the extra heat is projected to cause an additional 19,400 deaths in the Philippines, Vietnam, Thailand, and Cambodia, and 19,300 deaths in Indonesia. Other highly impacted regions over the next six months include India (15,800) and Brazil (13,300).
Our analysis shows that the timing of deaths will vary considerably between countries over the next six months. Those countries projected to see the largest number of excess heat-related deaths in the latter half of our forecast period – allowing more time to act – include Nigeria and Indonesia, which will face 15,400 and 10,400 more heat deaths than normal between December and February, respectively, and Brazil and India, which we project to see 8,000 and 7,400 additional heat-related deaths, respectively, over that three month period.
Looking beyond the current 6-month forecast window – which runs through February 2027 – we anticipate that key areas in the northern hemisphere, such as India and Pakistan, will see heat-related deaths continue to rise into their summer. We will provide updated, interactive forecasts pinpointing where heat-related deaths are likely to be concentrated and shift over time, giving decision-makers what they need to target interventions in real time through this period.
What can be done to prevent all these deaths?
These localized and time-sensitive projections can guide multilateral and humanitarian organizations’ decisions about where to direct emergency funds to reduce the number of deaths. Further, they allow national, state, and city governments to target their resources towards actions that are proven to work. CIL’s Adaptation Inventory finds that heat warnings, health outreach to vulnerable populations, cooling centers and hydration stations, worker protections, and expanded health system capacity can all help people cope with extreme heat.
This is more than a hot summer, it’s a postcard from the future
The anomalously warm temperatures that most of the globe will see during this El Niño event are a “postcard from the future”: while they feel anomalous now, they will become normal just a few decades into the future. Mortality projections for the near term provide a signal of where we are headed if new adaptation investments do not materialize. The difference with climate change is that there is more time to undertake adaptations to save lives.
Preventing these future heat deaths, however, requires us to know which adaptations actually work – and where. CIL’s Adaptation Inventory is built to answer exactly that. It is a rigorous and growing evidence base of adaptation interventions that have been proven to save lives and improve human welfare. Some solutions already exist – anticipatory financing; heat early warning systems and heat action plans that let health officials target vulnerable populations with home visits, expand water availability, and monitor heat-related symptoms; more accurate temperature forecasting; and wider access to cooling technologies – yet many have only been evaluated in specific geographies.
We need to build the evidence base now for what works and then invest in preparations and planning. Preparing for a hotter future will require a far more granular, continually updated understanding of what saves lives across different regions, climates, and health systems.
Methodology
For these seasonal mortality projections, we leverage research from the Climate Impact Lab that quantifies the relationship between temperature and excess mortality accounting for differences in local climate, vulnerability, and adaptive capacity. Those relationships, which are accounted for in 24,378 regions across the globe, are applied to the long-range forecasted temperature anomalies from the ECMWF SEAS5 resulting in projected changes in temperature-related excess mortality compared to the 1996-2025 average. Uncertainty in the projections stemming from the seasonal forecast, as indicated across the 51-member forecast ensemble, and from the quantification of the temperature-excess mortality relationships are carried throughout the analysis allowing us to provide insight into both the central estimate and its uncertainty. Full details on the method will be published in an upcoming peer-reviewed journal.
[1] Projections account for projected deaths from June 2026 (start of the current El Niño event) through the end of currently-available 6-month seasonal projections (February 2027).
[2] Ranges provided throughout the report represent the mean ± 1.96x standard error.
[3] All projected mortality projections shown in this report are relative to the matching months of an average year, treating 1996-2025 as the baseline normal. February 2027 is used as the end date here as we are using a 6-month seasonal forecast released in September. We expect the anomalously warm temperatures to continue through mid-2027 and therefore expect this estimate of heat-related excess deaths to continue to climb.
[4] Contains modified Copernicus Climate Change Service information. Neither the European Commission nor ECMWF is responsible for any use that may be made of the Copernicus information or data it contains. Copernicus Climate Change Service, Climate Data Store, (2024): ERA5 post-processed daily-statistics on single levels from 1940 to present. Copernicus Climate Change Service (C3S) Climate Data Store (CDS), DOI: 10.24381/cds.4991cf48 (Accessed on 03-Sep-2026).
[5] Copernicus Climate Change Service, Climate Data Store, (2018): Seasonal forecast daily and subdaily data on single levels. Copernicus Climate Change Service (C3S) Climate Data Store (CDS). DOI: 10.24381/cds.181d637e (Accessed on 09-Sep-2026).
[6] Copernicus Climate Change Service (C3S) (2023): Gridded monthly climate projection dataset underpinning the IPCC AR6 Interactive Atlas. Copernicus Climate Change Service (C3S) Climate Data Store (CDS). DOI: 10.24381/cds.5292a2b0 (Accessed on 03-Sep-2026).