

A much-anticipated update of the Climate Impact Lab’s popular Impact Map offers users high-resolution projections for how the number of extreme heat days will multiply over the course of the century, summer and winter temperature trends, and more, all based on the best science from the World Climate Research Programme’s Sixth Coupled Model Intercomparison Project (CMIP6).
Quality and detailed climate information is key to unlocking a more resilient future for communities around the world. The new temperature data update to our dynamic Impact Map allows users to develop a vastly deeper understanding of how global greenhouse gas emissions pathways will translate into future changes at a local level. Based on an analysis of our open and freely available Global Downscaled Projections for Climate Impacts Research (GDPCIR) dataset, released this spring on the Microsoft Planetary Computer, the projections correspond to the latest global climate model simulations prepared as part of the U.N. Intergovernmental Panel on Climate Change’s Sixth Assessment Report.
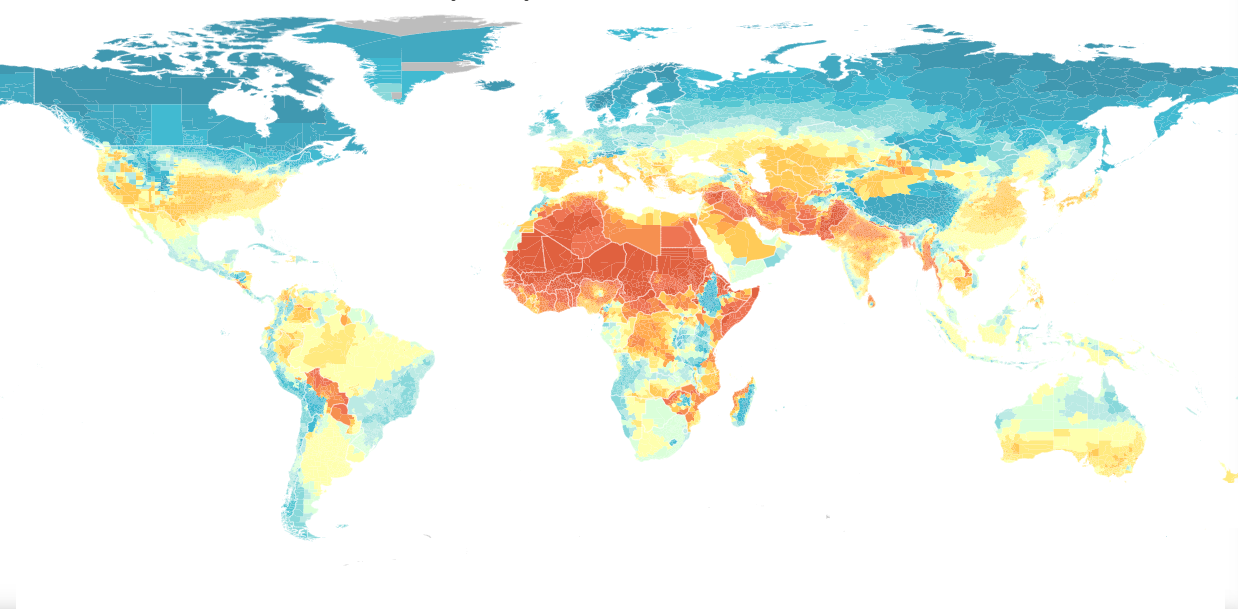
The Impact Map offers an accessible way for the public to learn how extreme heat, days below freezing, average annual temperatures, and seasonal trends are likely to unfold in coming decades and beyond, all based on the latest socioeconomic and emissions scenarios developed by global research teams. Users can explore median, 1-in-20 high, and 1-in-20 low probability projections along three pathways:
- SSP2-4.5: a moderate emissions scenario that aligns with countries meeting their Paris Agreement commitments to keep warming below 2 degrees Celsius
- SSP3-7.0: a moderate-high emissions scenario that represents global carbon emissions continuing to rise every year throughout the 21st century
- SSP5-8.5: a very high emissions scenario that represents a worst-case outcome of continued fossil-fueled development in which carbon dioxide emissions triple by 2075
Each step in our data processing has been carefully documented, improving the transparency of the information. This latest update, which includes free downloadable datasets, ensures accurate and actionable climate information is available to the public.
Our future research priorities include updating all of the Climate Impact Lab sector-specific impact projections, including the Mortality and Energy costs layers currently available on the Impacts Map, to be consistent with CMIP6 climate scenarios. By providing quantified information on how temperature changes will affect multiple dimensions of our economy and human welfare, we provide a granular, evidence-based perspective on the future costs of climate change. Visit our Estimating Climate Change Damages video series for more information.
The Climate Impact Lab extends its sincere gratitude to The Rockefeller Foundation for its support of this project.