By: Tamma Carleton and Ashwin Rode
The amount of energy we consume depends critically on the climate. On hot days, air conditioning use soars, while cold days raise natural gas demand alongside other heating fuels. What this means for global energy systems under climate change, however, remains a difficult question. Millions of people lack access to life-saving cooling and heating technologies, and climate change will unfold gradually over decades in which many other variables can change.
Projections of energy use under climate change are essential for infrastructure planning, risk assessment, and climate policy design. Importantly, energy access allows us to adapt and respond to heat, and without adaptation, rising temperatures from climate change will be deadly and will slow economic progress, particularly for the world’s poorest populations.
To fill this knowledge gap, we worked alongside our colleagues at the Climate Impact Lab to examine energy use data from 146 countries over four decades, matched to historical weather observations. Our recent publication in Nature describes the novel statistical methodology we employed to measure how the effect of extreme temperatures on energy consumption varies for populations at different income levels and climates across the globe. We then use these measured relationships to project the impacts of future climate change on energy consumption, framing our findings in the context of the “social cost of carbon” (SCC), defined as the total monetary value of the global damages — across many economic sectors — caused by the emission of one ton of CO2.
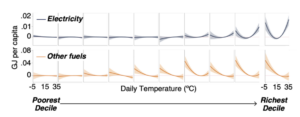
We find that the relationship between energy consumption and temperature is strongly dependent on per-capita income (Figure 1). For wealthy populations, electricity consumption soars on hot days. However, for the majority of today’s global population, extreme heat results in virtually no increase in electricity consumption, as these populations lack the resources and energy infrastructure to access cooling technologies such as air-conditioning. In contrast, on extreme cold days, we see an uptick in energy consumption among all but the poorest regions.
 Figure 1: The impact of extreme temperatures on energy consumption depends on income. This figure shows the impact of a day at each temperature (relative to a day with average temperature 20°C) on per capita electricity and other fuels consumption, for each decile of the present-day global income distribution. The shaded areas indicate 95% confidence intervals.
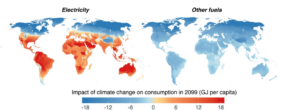
Combining these relationships with global projections of future climate and incomes, we find that rising temperatures over the 21st century will unequally impact energy consumption across locations and fuel types. Most of the world will increase electricity consumption due to warming (Figure 2, left map), but the amplitudes and implications of the increase will vary tremendously across locations. Many of the poorest regions today (e.g., in sub-Saharan Africa) are expected to remain too poor for most of the century to substantially increase consumption in response to warming, leaving those populations vulnerable to heat-related illness and mortality. However, some emerging economies — increasingly able to afford cooling technologies — will see dramatic increases in consumption by end-of-century relative to current levels (e.g., 145% increase in electricity consumption in India), posing a formidable infrastructure planning challenge. By contrast, in rich countries with temperate climates in the Global North, increases at end-of-century will amount to a small fraction of current consumption (e.g., 3% in the US).
Declines in consumption of fuels commonly used for heating are projected throughout the world (Figure 2, right map). These declines, along with the slow uptake of cooling technologies in poorer parts of the world, imply that climate change will lead to a net decline in total global energy expenditures. However, this finding masks vastly unequal impacts around the world, as described above.

Figure 2: The impact of climate change on energy consumption across the globe. The maps indicate the impact of climate change on consumption of electricity (left) and other fuels (right). Values are shown for the year 2099 under the high emissions scenario (SSP3-RCP8.5). Colors indicate the mean projection for each region.
The impacts of climate change on energy consumption have important implications for calculating the SCC, which is integral to building evidence-based climate policies, as it allows policymakers to weigh the costs of mitigating climate change against its benefits. This study contributes to a broader effort at the Climate Impact Lab to calculate the SCC, existing estimates of which rely on decades-old climate science and economics and data based solely on wealthy countries.
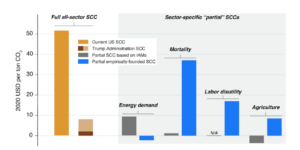
We compute a “partial” SCC for energy consumption between -$3 and -$1 per ton. That is, on net an additional ton of CO2 slightly reduces energy spending. This contradicts older evidence that informs the U.S. government’s SCC, which suggested that increased emissions would dramatically increase energy spending (Figure 3). Similarly, our work on human health and labor indicates that the current SCC substantially miscalculates climate damages in these sectors (Figure 3), severely underestimating the former and altogether ignoring the latter. We hope that these results and our ongoing research at the Climate Impact Lab will help contribute to a new era of evidence-based climate policy in the U.S. and across the globe.

Figure 3: Current U.S. Social Cost of Carbon (SCC) lags behind frontier science. Figure compares current and past U.S. federal SCCs to those produced by recent research. The all-sector SCCs shown on the left include values used by the Trump Administration (brown) and the interim estimate under the Biden Administration (gold). Sector-specific “partial” SCCs on the right come from the Interagency Working Group 2013 implementation of the FUND model (one of the three models used to derive the U.S. federal all-sector SCC; grey) and recent scientific literature (blue). Source: Carleton and Greenstone (2021).
This post originally appeared on The Bren School of Environmental Science & Management’s emlab blog.


