

This study is a core input to the Climate Impact Lab’s Data-driven Spatial Climate Impact Model (DSCIM).
Abstract
Energy for cooling and heating plays a crucial role in our ability to cope with extreme temperatures. How do populations around the world alter their energy use in response to heat waves and cold spells? How does this response differ across fuel types, like natural gas, oil, and coal? How is it shaped by factors like a household’s access technology, such as heaters, fans, or air conditioning units? Answering these questions is essential for understanding how a changing climate will affect global energy systems—a cornerstone of the modern economy. Communities are already experiencing a changing climate as record-breaking temperatures become a familiar trend globally. Yet, the impacts of climate change on energy use will vary locally, as individuals, communities, and businesses adapt to local conditions using available resources. This study provides a globally comprehensive, detailed understanding of these impacts and behavioral adaptations, offering critical insights for policymakers, energy systems planners, business leaders, and a range of stakeholders who are preparing to mitigate and adapt to a more unstable climate.
Key Takeaways
- Using data from 146 countries over 40 years, this study quantifies the effect of temperature on electricity and direct fuel consumption across residential, commercial, and industrial end-uses. Notably, the study measures how this effect differs across income levels and climate zones.
- The authors use these globally representative, data-driven results to project the future impact of climate change on consumption of electricity and other fuels consumption in 24,378 globally comprehensive geographic regions. Their novel approach reflects the effects of behavioral adaptations like air-conditioning adoption that populations in each region undertake as they become more affluent and exposed to warmer climates.
- In the world’s present-day richest locations, electricity consumption increases substantially on days with mean temperatures of 35°Celsius/95°Fahrenheit, compared to a day at 20°C/68°F, reflecting access to protective cooling technologies. However, these costly technologies are largely out of reach for today’s lower-income populations. For the poorest 60% of the present-day global income distribution (populations with per capita income less than $11,300), these high temperatures result in virtually no increase in electricity consumption.
- Electricity consumption in wealthy locations also increases substantially on extremely cold days, with mean temperatures of 0°C/32°F. In addition, direct consumption of other fuels increases on these cold days for all but the poorest 20% of the present-day global income distribution (per capita income < $2,800), reflecting the widespread use of fuels like natural gas, oil, and coal for heating around the world.
- While income is the primary driver of how much energy a population consumes in response to extreme temperatures, prior experience with hot and cold temperatures also plays a role. For instance, a hot day with an average temperature of 30°C/86°F results in a 20% larger increase in electricity consumption in Houston, Texas, than in Seattle, Washington. While both are relatively wealthy U.S. cities, the differential response to a hot day reflects greater air-conditioning adoption in warmer climates (Houston) than in cooler climates (Seattle).
- The authors project that rising temperatures over the 21st century will lead to important shifts in energy consumption across locations and fuel types, but on net, these shifts will result in modest net savings in global total energy expenditures. Many parts of the world are expected to remain too poor for most of the 21st century to substantially increase energy consumption in response to warming. By the end of the century, emerging economies in the tropics, such as India, Indonesia, and Vietnam, are projected to increase electricity consumption dramatically in response to warmer temperatures, requiring critical infrastructure planning. However, heating reductions in colder countries due to fewer cold days offset this increase globally.
- The new analysis calculates that warming caused by an additional ton of CO2 released today is projected to reduce total future global energy expenditures, with most estimates valued between -$3 and -$1, depending on discount rates. This finding using the Climate Impact Lab’s Data-driven Spatial Climate Impact Model (DSCIM) contradicts prior studies, which suggested that warming will dramatically increase total global energy expenditures due to greater demand for cooling. However, these studies were calibrated with data exclusively from wealthy countries. As a result, they have failed to account for the slow uptake of cooling technologies like air-conditioning in poorer parts of the world. While focusing on data from only wealthy locations can lead to overestimates of certain climate change damages, such as energy expenditures, a similarly limited data focus has been shown to severely underestimate damages in other areas, for example, human mortality.
Introduction
The world is already experiencing a changing climate, and warming temperatures are a key example of this. Global average temperature has exhibited an ongoing and dramatic upward trend, with the last seven years being the warmest seven years on record. Heat waves routinely lead to record-breaking temperatures around the world. In late July 2021, simultaneous heat waves over vast areas of the Northern Hemisphere resulted in all-time record high temperatures in locations as far apart as Turkey, northern Japan, and Northern Ireland. Less than a month earlier, locations across western North America experienced unprecedented high temperatures. For instance, Portland, Oregon, reached an all-time high of 46.7°C/116°F, shattering the previous record by 5°C/9°F in this typically temperate city.
Extreme heat can take a toll on human health, comfort, and productivity in many ways, compelling populations to respond by consuming energy to power cooling technologies. However, at present, these costly technologies are far from uniformly accessible throughout the world. For example, while some form of air-conditioning is present in 90% of homes in the United States, this is currently true for only 5% of homes in India. This disparity between rich and poor populations’ ability to protect themselves from extreme temperatures is central to understanding the impacts of climate change, including its impacts on global energy systems.
What exactly is the relationship between temperatures—both hot and cold—and energy consumption? How much do people at different income levels and inhabiting different climate zones consume various fuels to adapt to extreme hot and cold temperatures? As economic development and global climate change unfold over the coming century, what do these relationships imply about the energy expenditure costs imposed by a warmer climate? Knowing the answers to these questions at a local and global scale would be of tremendous practical value to policymakers, energy systems planners, business leaders, and a range of stakeholders looking to mitigate and adapt to a warming climate. Prior research suggests that significant, warming-driven increases in energy expenditures could be the predominant cost of climate change globally and one of the most uncertain costs. Because emissions today stay in the atmosphere for hundreds of years, resolving this uncertainty and improving our understanding of climate damages will be essential to taking action we need to prepare for future risks.
Researchers have struggled to provide a credible and complete understanding of the damages inflicted by climate change at a local and global scale. In the case of energy expenditure costs, prior empirical studies have measured the effect of temperature on electricity use, although they often omitted non-electric energy use, like natural gas used for heating, because the data were difficult to obtain. Moreover, these studies generally focused on residential end uses in wealthy regions, such as California, and thus were not globally representative. In contrast, process-based models have tried to comprehensively capture the global nature of the problem by simulating how climate change will affect all aspects of the production, conversion, delivery, and use of energy. However, the lack of globally representative empirical studies to calibrate key implicit modeling assumptions weakens the authority of the insights derived from these models. In particular, to date, there have been no globally comprehensive, spatially resolved, data-driven studies of how energy consumption behavior responds to warming.
Research Design
In this study, the authors produce the first global, high-resolution, data-based estimate of the energy expenditure costs of climate change, accounting for the role of income growth and adaptation. Their methodology underlies all the work of the Climate Impact Lab:
- Gather Detailed Global Economic and Climate Data: The first step is an unprecedented effort to aggregate highly localized historical data across key economic and climate indicators.
- Measure Climate-Driven Costs to Society: Millions of historical observations are then analyzed to understand and quantify the effect of climate change on energy consumption.
- Inform Decision-Making at the Macro and Micro Levels: The socioeconomic relationships estimated from our current data are used to produce risk-based estimates of future changes at the local level, around the entire world.
Specifically, this study uses globally comprehensive historical data on non-transport end-use energy consumption to quantify how electricity and direct fuel consumption across the globe has been affected by observed climate changes. The authors utilize the World Energy Balances dataset of the International Energy Agency, which describes electricity and direct fuel consumption across residential, commercial, industrial, and agricultural end-uses in 146 countries during 1971-2010.
By combining these records with decades of detailed daily and local temperature observations, the authors discover that extreme cold and extreme heat have important effects on energy consumption. These relationships differ by energy type (electricity, other fuels) and are modified by the income levels and climate of the affected population. The study uses these results to model how income growth and adaptation affect the sensitivity of energy consumption to extreme temperatures.
The authors then use these estimates of the energy-temperature relationship to generate projections of the future impacts of climate change on electricity and direct fuel consumption for areas across the globe, dividing the world into 24,378 distinct regions. Each region contains roughly 300,000 people—about the size of a U.S. county. The projected impacts capture the effects of adaptive behaviors that populations undertake as they become richer and exposed to warmer climates.
These estimates include five projections for future income and population growth, two trajectories of future greenhouse gas emissions, eight scenarios of future energy prices, and simulations from 33 climate models, allowing for an assessment of the uncertainty surrounding any particular projection. The full estimates also reflect statistical uncertainty related to the underlying economic and energy data.
Projected impacts of climate change on energy consumption are then monetized and used to determine climate change’s effect on excess energy expenditures each year with the Data-driven Spatial Climate Impact Model (DSCIM). Monetizing future years’ impacts allows the authors to compute the total burden of energy expenditures imposed by the emission of a single ton of carbon dioxide (CO2).
This value represents the first peer-reviewed, empirically derived estimate of the global cost of climate change for a single sector of the economy. The authors are applying the method to other sectors of the economy, including agriculture and human health, which will enable the calculation of the full Social Cost of Carbon that tallies damage across many sectors of the global economy.
Findings
1. Only the world’s richest populations show evidence of using electricity for cooling during extreme heat or heating during extreme cold.
The global rich substantially increase their electricity consumption on extreme hot and cold days, reflecting their use of protective cooling and heating technologies. In particular, for populations in the top decile of the present-day global income distribution (per capita income greater than $34,200), electricity consumption is, on average, 0.017 gigajoules (GJ)-per-capita higher on a day with a mean temperature of 35°C/95°F, compared to a day at 20°C/68°F. This average daily increase equates to 4.6 kilowatt-hours (kWh)-per-capita, or 66% of 2010 global average per capita daily consumption. Similarly, electricity consumption is 0.0068 GJ-per-capita (1.9 kWh-per-capita) higher on a 0°C/32°F day, compared to a day at 20°C/68°F. This equates to 27% of 2010 global average per capita daily consumption.
This pattern of increasing consumption with hot and cold temperatures appears to a lesser degree in the 7th to 9th deciles of the global income distribution (per capita income $11,300 to $34,200) but does not apply at lower income levels (Figure 1). For populations in the poorest 6 deciles of the present-day global income distribution (per capita income less than $11,300), extreme hot or cold days result in virtually no increase in electricity consumption. This disparity reflects a lack of access to the costly protective technologies commonly used by the global rich, like air-conditioning.
While income is the primary driver of how much energy a population consumes in response to extreme temperatures, prior climate exposure also plays a role. For instance, a hot day with an average temperature of 30°C/86°F C results in a 20% larger increase in electricity consumption in Houston, Texas, than in Seattle, Washington. While both are relatively wealthy U.S. cities, the differential response to a hot day reflects greater air-conditioning adoption in warmer climates (Houston) than in cooler climates (Seattle).
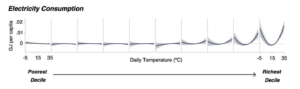
Figure 1: The impact of extreme temperatures on electricity consumption depends on income. This figure shows the impact of a day at each temperature on per capita electricity consumption (gigajoules), for each decile of the present-day global income distribution. In the poorest six deciles, extreme hot or cold temperatures have no effect on consumption. From the 7th decile onward, rising incomes lead to larger effects of extreme temperatures on consumption. The shaded areas indicate 95% confidence intervals.
2. Across most of the world, populations show evidence of consuming non-electricity fuels for heating on extreme cold days.
Except for the poorest 20% of the present-day global income distribution (per capita income less than $2,800), populations throughout the world increase their direct consumption of non-electricity fuels on extreme cold days, reflecting the widespread use of fuels such as natural gas, oil, and coal for heating. For the 80% of populations with access to these fuels, rising incomes amplify the extent to which non-electricity fuel consumption increases on cold days (Figure 2). For populations in the top income decile, consumption is, on average, 0.034 GJ-per-capita higher on a day with a mean temperature of 0°C/32°F, compared to a day at 20°C/68°F. That equates to 50% of 2010 global average per capita daily consumption.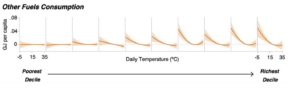
Figure 2: The impact of extreme temperatures on consumption of other fuels depends on income. This figure shows the impact of a day at each temperature on per capita other fuels consumption (gigajoules), for each decile of the present-day global income distribution. Extreme cold temperatures lead to increased consumption in all but the poorest two deciles. From the 3rd decile onward, rising incomes lead to larger effects of extreme cold temperatures on consumption. The shaded areas indicate 95% confidence intervals.
3. Climate change’s impact on temperatures is projected to increase electricity consumption in most parts of the world but decrease the consumption of other fuels. Together these effects lead to a modest net decline in global total energy expenditures.
In a scenario of continued high emissions that results in 4.5°C of predicted warming by the end of the century (SSP3-RCP8.5), the researchers project that by 2100, most of the world is expected to increase net annual per-capita electricity consumption and decrease consumption of other fuels due to climate change (Figure 3). The amplitude of these effects reflects differences in incomes and climates across locations. Hot and wealthy areas exhibit significant net increases in electricity consumption. Frigid locations exhibit net declines where warming does not increase the number of hot days enough to offset the loss of cold days. Poor regions, such as much of sub-Saharan Africa, do not increase electricity consumption as dramatically because incomes are projected to remain relatively low there at end-of-century. Direct consumption of other fuels declines throughout the world, consistent with the decreased use of these fuels for heating across a broader range of incomes.
Under the high emissions scenario, global annual electricity consumption in 2100 is projected to increase due to climate change by 1.21 GJ-per-capita, while consumption of other fuels will decline 2.94 GJ-per-capita. This amounts to an increase on par with 13% of 2010 global average per capita annual consumption, and a decline on par with 12% of global average consumption. Under a moderate emissions scenario that leads to an expected 2.4°C degrees of warming by the end of the century, the corresponding increase and decline are 0.44 GJ per capita and 1.16 GJ per capita, respectively.
The combined projected impacts on electricity and other fuels consumption imply a modest decline in total global energy expenditures due to climate change. Under a high emissions scenario, the decline in spending in 2100 amounts to 0.05% to 0.69% of that year’s projected global GDP, depending on the future energy price scenario. Corresponding estimates under the moderate emissions scenario are 0.02% to 0.30% of the year 2100 GDP.
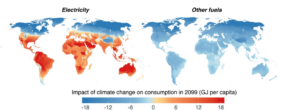
Figure 3: The impact of climate change on energy consumption across the globe. The maps indicate the impact of climate change on consumption of electricity (left) and other fuels (right). Values are shown for the year 2099 under the high emissions scenario (SSP3-RCP8.5). Colors indicate the mean projection for each region.
4. Compared to current levels, the projected increases in electricity consumption due to climate change are substantial in many of today’s developing economies, posing a formidable infrastructure planning challenge in these locations.
Although the researchers project climate change to have modest impacts on total global energy expenditures, these aggregate effects mask important shifts in projected energy consumption—shifts that will pose particular challenges in many of the poorest countries while generally being less severe in today’s rich countries. In many of today’s rich countries, impacts in 2100 are projected to be modest relative to current consumption, for instance, a +3% relative increase in annual U.S. electricity consumption (Figure 4). This small magnitude is both due to high current consumption levels in conjunction with the fact that many rich countries are in temperate climates, where projected increases and decreases in electricity consumption—from more hot days and fewer cold days, respectively—offset one another.
In contrast, in many of the poorest countries, the additional consumption imposed by climate change is projected to be substantial relative to current consumption. Nigeria will experience more than a 2000% relative increase in annual electricity consumption (Figure 4). This is due both to uniformly hot temperatures and very low levels of current energy use.
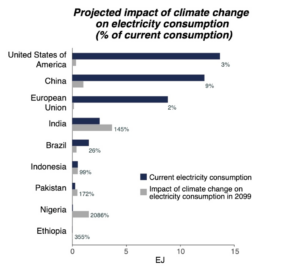
Figure 4: Relative to current consumption levels, the impact of climate change on electricity consumption is largest in developing countries. Grey bars display impacts of climate change on total electricity consumption (exajoules) in 2099 under the high emissions scenario (SSP3-RCP8.5) for selected countries. Blue bars indicate each country’s current consumption.
5. The warming caused by each ton of CO2 released today is projected to, on net, reduce global energy expenditures, with most estimates valued between -$3 and -$1.
When adding up climate change’s projected impact on this sector, the researchers find that each additional ton of CO2 emitted today results in a net reduction in future energy expenditures. The present value of these expenditure changes varies depending upon the discount rate, emissions scenario, and energy price scenario assumed, with most estimates valued between -$3 and -$1 of savings per ton. This value calculated using DSCIM is also known as the “Partial Social Cost of Carbon for Energy Consumption.” A “full” Social Cost of Carbon would encompass climate change impacts across all affected sectors of the economy.
Applying the same 3% discount rate used in the current U.S. federal government’s Social Cost of Carbon, the Climate Impact Lab estimates that the partial Social Cost of Carbon for Energy Consumption is -$1.3 under a scenario of continued high emissions.[1] Current U.S. policy relies on an interim full Social Cost of Carbon value of roughly $50 per ton of CO2 emitted in 2020—the most robust and credible estimate available. Previous research has attempted to tease out the value of energy consumption impacts in the three Integrated Assessment Models that underlie that estimate. Still, academic literature gives limited options for comparison. The FUND model, for example, reports values for changes to cooling and heating expenditures that amount to a net increase of $10 per ton (2019 USD), differing from our estimates in both direction and magnitude (Figure 5). However, key parameters in the FUND model were calibrated with data exclusively from wealthy countries. As a result, the model failed to account for the slow uptake of cooling technologies in poorer parts of the world, which this study uncovers when using global data.
While focusing on data from only wealthy locations can lead to overestimates of certain climate change damages, such as energy expenditures, a similarly limited data focus has been shown to severely underestimate damages in other areas. For instance, the Climate Impact Lab’s data-driven estimate of the mortality damages from an additional ton of CO2 is dramatically higher than its counterpart in FUND (Figure 5). These empirically grounded, globally representative damage estimates point to the need for continued revision of the Social Cost of Carbon estimates.
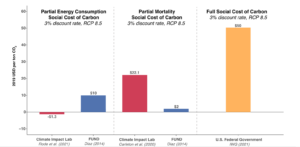
Figure 5: Estimates of a partial Social Cost of Carbon (SCC) for energy consumption and mortality from the Climate Impact Lab, compared to existing partial and total SCC estimates. Climate Impact Lab and FUND estimates account for either energy consumption or mortality-related costs, as indicated. U.S. federal government estimates account for all sectors of climate change impacts.
Policy Implications
This study demonstrates the feasibility of combining global data, big data analytics, and detailed climate models to estimate the costs of climate change, and the benefits of reducing CO2 emissions. Although demonstrated in this case for energy expenditure costs, the approach used in this study can be extended to the full range of outcomes potentially affected by climate, thereby providing a globally representative, data-driven characterization of the full Social Cost of Carbon. Such a bottom-up, empirical characterization can provide fresh insights to policymakers on both the overall value of the Social Cost of Carbon, as well as the relative importance of the damages it comprises.
Further, the results of this study provide estimates of the changes in energy consumption by energy type (electricity and other fuels) for 24,378 unique regions that together account for the entire world. The Biden administration recently provided initial guidance to agencies for implementing the president’s pledge that 40% of the benefits of covered clean energy, climate, and transportation investments flow to “disadvantaged communities.” As the administration turns its focus to defining a “disadvantaged community,” policymakers need data at a high spatial resolution on the local impacts of climate change. In addition to supporting environmental justice initiatives, the localized climate impact information presented in this paper provides key insights for policymakers at all levels of government to debate the importance and value of investing in adaptation measures. For instance, energy utility planners can use localized information to plan for increased capacity during peak electricity demand periods or considering whether existing energy system equipment can reliably operate into the future in a changed climate.
Data availability
The data for replicating the findings of this study are available on Zenodo at https://doi.org/10.5281/zenodo.5099834.
Code availability
The code for replicating the findings of this study is available on GitHub at https://github.com/ClimateImpactLab/energy-code-release-2020/.
ABOUT THE CLIMATE IMPACT LAB
The Climate Impact Lab is a collaboration of more than 30 researchers from the Global Policy Laboratory at the University of California, Berkeley, the Energy Policy Institute at the University of Chicago (EPIC), Rhodium Group, Rutgers Institute of Earth, Ocean, and Atmospheric Sciences at Rutgers University, the Bren School of Environmental Science and Management at the University of California, Santa Barbara, the University of Delaware, Princeton University, and Fudan University. Together, they are linking state-of-the-art climate modeling, economic statistics, and big data analytics to build the world’s most comprehensive body of research quantifying the impacts of climate change around the globe. EPIC provides core financial and administrative support for the Lab. Learn more at impactlab.org
[1] This estimate assumes future energy prices reflect historical average US price growth (1.4% per year).