Abstract
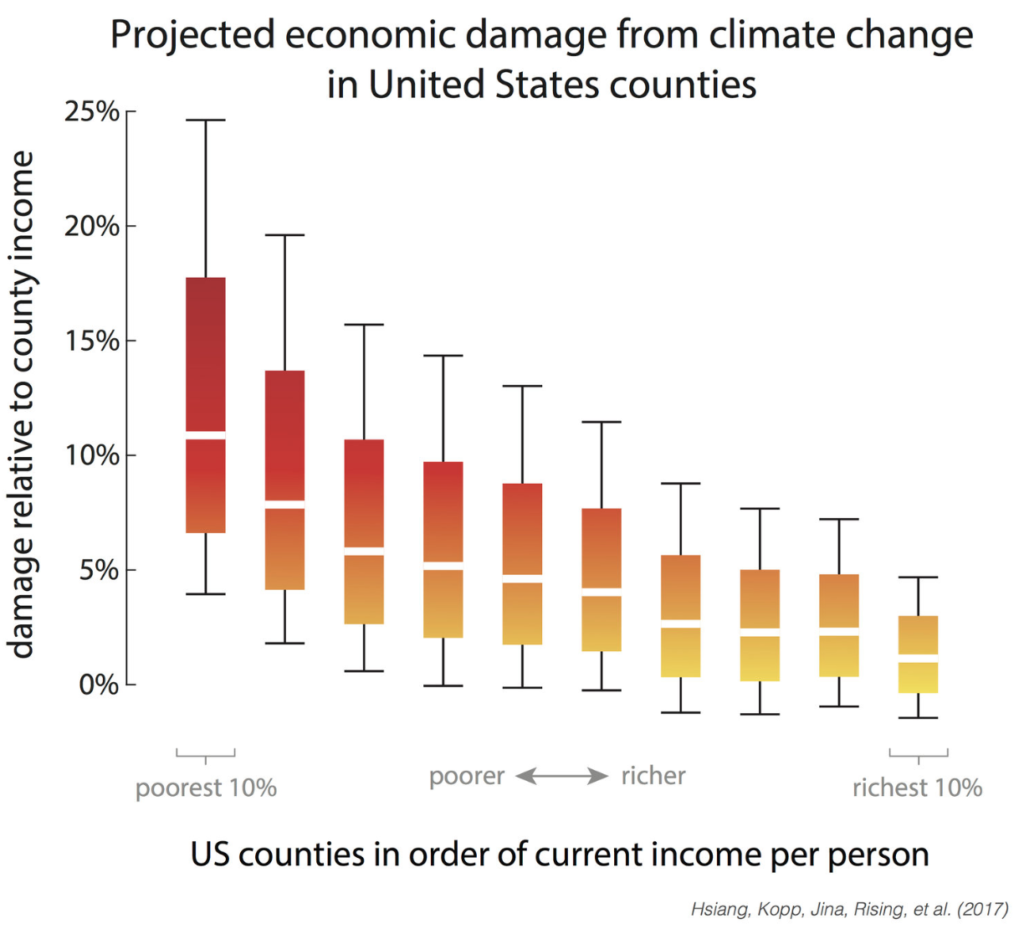
Estimates of climate change damage are central to the design of climate policies. Here, we develop a flexible architecture for computing damages that integrates climate science, econometric analyses, and process models. We use this approach to construct spatially explicit, probabilistic, and empirically derived estimates of economic damage in the United States from climate change. The combined value of market and nonmarket damage across analyzed sectors—agriculture, crime, coastal storms, energy, human mortality, and labor—increases quadratically in global mean temperature, costing roughly 1.2% of gross domestic product per +1°C on average. Importantly, risk is distributed unequally across locations, generating a large transfer of value northward and westward that increases economic inequality. By the late 21st century, the poorest third of counties are projected to experience damages between 2 and 20% of county income (90% chance) under business-as-usual emissions (Representative Concentration Pathway 8.5).
DATA DOWNLOAD
This data is provided for non-commercial research and educational purposes.
County-level damages by sector (CSV) – This file contains median damages for each sector shown in Fig 2 of the main article (agriculture, mortality, energy, low-risk labor, high-risk labor, coastal damages, property crime, violent crime, total damages). These impacts are the central estimate for average annual damage during 2080-2099 under a business-as-usual scenario (RCP8.5).
Total economic damages for each county by likelihood (CSV) – This file contains total damages for each county as a fraction of county income, similar to Fig 2I in the main article except, it also contains ranges of total damages likelihood intervals (as shown in Fig 5C in the main article) defined using the standards set by the IPCC. The file contains median estimates (50 percentile, figure below), as well as the likely range (17-83 percentiles, which is the 66% chance central interval), and the very likely range (5-95 percentiles, which is the 90% chance central interval). All values are percent of county income.

Total economic damages distributions for each income decile of counties (CSV) – This file contains descriptions of total damages for US counties grouped by their income decile (data used to make the figure below). For each decile, the file contains median estimates (50 percentile), as well as the likely range (17-83 percentiles, which is the 66% chance central interval), and the very likely range (5-95 percentiles, which is the 90% chance central interval).


