In an op-ed for the New York Times, Lab co-directors Solomon Hsiang and Trevor Houser quantify the potential cost of Hurricane Maria for the Puerto Rican economy and highlight the importance of a large, timely, sustained and well-designed disaster relief aid package in mitigating that impact.
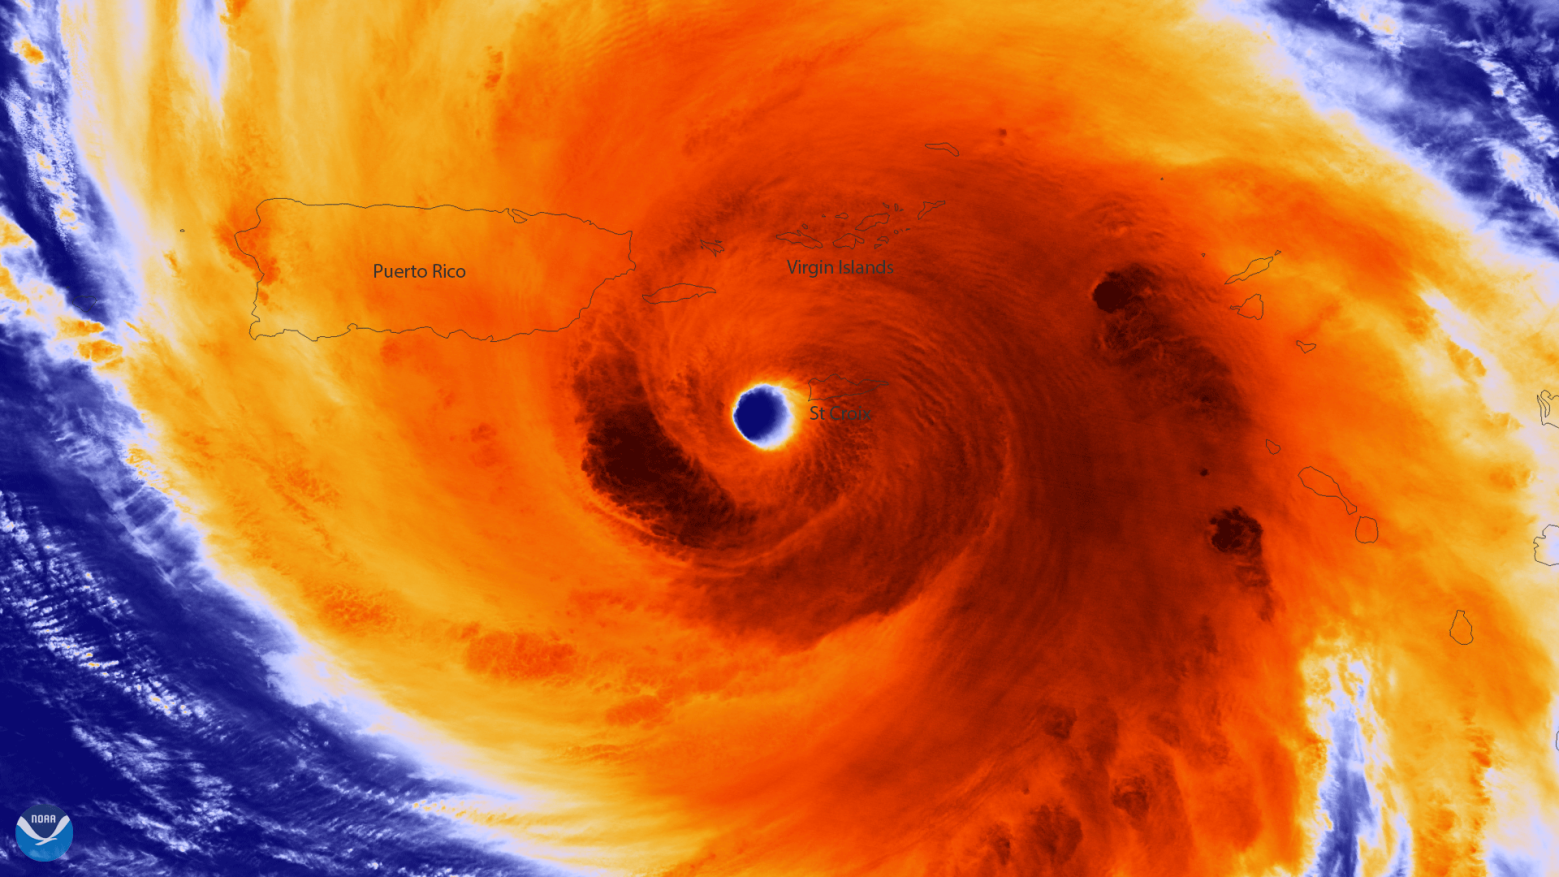
Maria was a record-breaking storm. To see just how powerful it was, Sol ran Maria’s track datathrough an updated version of his LICRICE model, which reconstructs the experience of individuals on the surface as a cyclone passes overhead (see Figure 1). Measured against a database of 13,000 cyclone events around the world since 1950 (one event is one cyclone striking one country), it ranks 6th in terms of average wind speed experienced across an entire geographic territory (Table 1). During Maria, maximum experienced wind speeds, averaged across all of Puerto Rico, were 123 miles per hour (essentially Category 3 wind speeds), with some parts enduring 158 mph winds.
Figure 1: Maximum surface wind speeds during Hurricane Maria
This kind of event, where an entire territory is uniformly blasted with this kind of intense wind, is really, really rare—especially for a territory that is so large and home to millions of people. Of the five events since 1950 that top Maria by this metric, all were on much smaller locations (Guam, Hong Kong, and the Northern Mariana Islands) making it easier to achieve high intensity scores per area of land affected. Even more notably, all five were in the Pacific Ocean, the size and temperature of which has historically led to more intense storms. In more than sixty years of data, there has never been an Atlantic hurricane event as intense as Maria’s strike on Puerto Rico. The Atlantic is the new Pacific.
Table 1: Top 10 strongest cyclone years since 1950 by average wind speed over land

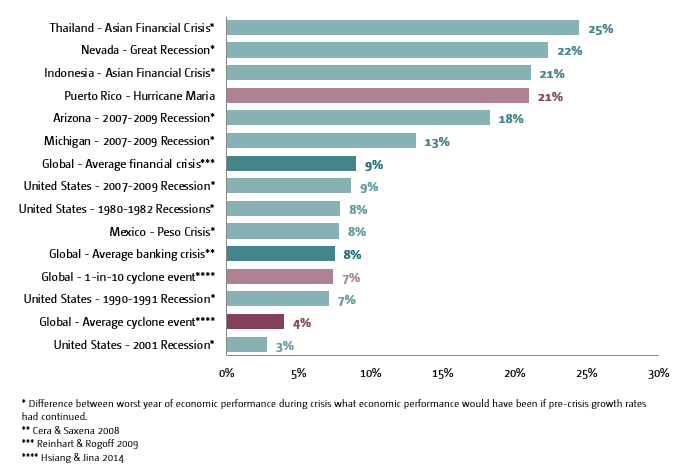
But Maria was not an average cyclone event, a 1-in-10 event or even a 1-in-100 event. Considering both her physics and how she mapped on the Puerto Rican territory, Maria was more like a a 1-in-3,000 event (and that’s before factoring in Irma as prologue). And this superlatively is reflected in the severity of her potential long-run economic impact. Maria has the potential to reduce Puerto Rican economic output by 21% within the next 15 years on a per capita basis. That’s comparable to some of the worst economic crisis in recent history – including the impact of the 1997 Asian Financial Crisis on Thailand and Indonesia – and the impact of the Great Recession on the most heavily impacted US states (Figure 2).

Between 2009 and 2015, Puerto Rico delivered average annual per capita GDP growth of 0.8% (though overall economic output declined due to out-migration). If the pre-storm outlook was for that rate of growth to continue, it will now take Puerto Ricans 26 years just to return to current income levels (Figure 3). Every sixty seconds that Puerto Rico suffered through Hurricane Maria, roughly a week’s worth of economic development was lost.
Figure 3: The impact of Hurricane Maria on the Puerto Rican economy (per capita GDP in real 2009 USD)
Before Maria, most analysts projected less than the 0.8% per capita growth rate Puerto Rico averaged between 2009 and 2015 due to the island’s debt crisis. In it’s April World Economic Outlook, however, the IMF forecast a 0.9% average annual decline in per capita incomes between 2016 and 2022. In a new paper, Greg Makoff and Brad Setser outline a range of pre-storm headwinds to future economic growth. If these more pessimistic outlooks are a more accurate pre-storm baselines, Maria puts the Puerto Rican economy event deeper in the hole.
In the op-ed, Sol and Trevor highlight the ability of a significant and sustained aid package to help mitigate Maria’s projected economic damage. With the island on the verge of a humanitarian crisis, the first priority is delivering emergency relief. But that is just the beginning of Puerto Rico’s long road to recovery. The electrical grid was destroyed by the storm and will need to be completely rebuilt. Thousands of buildings and hundreds of miles of roads need to be repaired or replaced. The island’s communications systems, farms and ranches have been decimated. Without proactive economic support from Washington, thousands of American families and businesses will be bankrupt by rebuilding costs. Many will suffer from unemployment and other hardships, which will then translate into a much larger burden for American society writ large. Research by Professor Tatyana Deryugina at University of Illinois has shown that historically, when US counties are hit by hurricanes, there are large and persistent increases in how much welfare aid goes to those counties for the following decades, to the tune of $1,700 per capita in net present value for a Category 3+ storm. Timely recovery funding that engages local communities in rebuilding efforts can help avoid this fate.
Clearly, this is not the last hurricane Puerto Rico will experience, and our recent analysis of the economic impacts of climate change across the U.S. indicates that if we don’t change our building patterns and emissions trends, climate change (including sea level rise) could double the cost of cyclone damages.
Part of the reason these costs are so large is that we haven’t invested heavily in the kinds of smart and robust infrastructure that can weather storms, but that doesn’t mean that kind of infrastructure is impossible to build. Sol conducted a 2012 study with Professor Daiju Narita from Hokkaido University where they showed that the probability assets and lives are lost in cyclones usually declines as country’s get richer. This relationship holds almost everywhere in the world, except for the USA (see Figure 4). For each 1 mph of wind speed, the USA exhibits rates of damage that match China and India. Other wealthy countries exposed to cyclones, like Japan and Australia, do not suffer nearly the same losses. We can do better by rebuilding using some of the ideas and technologies employed in these other countries. Smart reconstruction will reduce the economic impact of the next storm, and the next storm, and the next storm…
Figure 4: Economic damage of hurricanes (percent damage per unit of wind)


